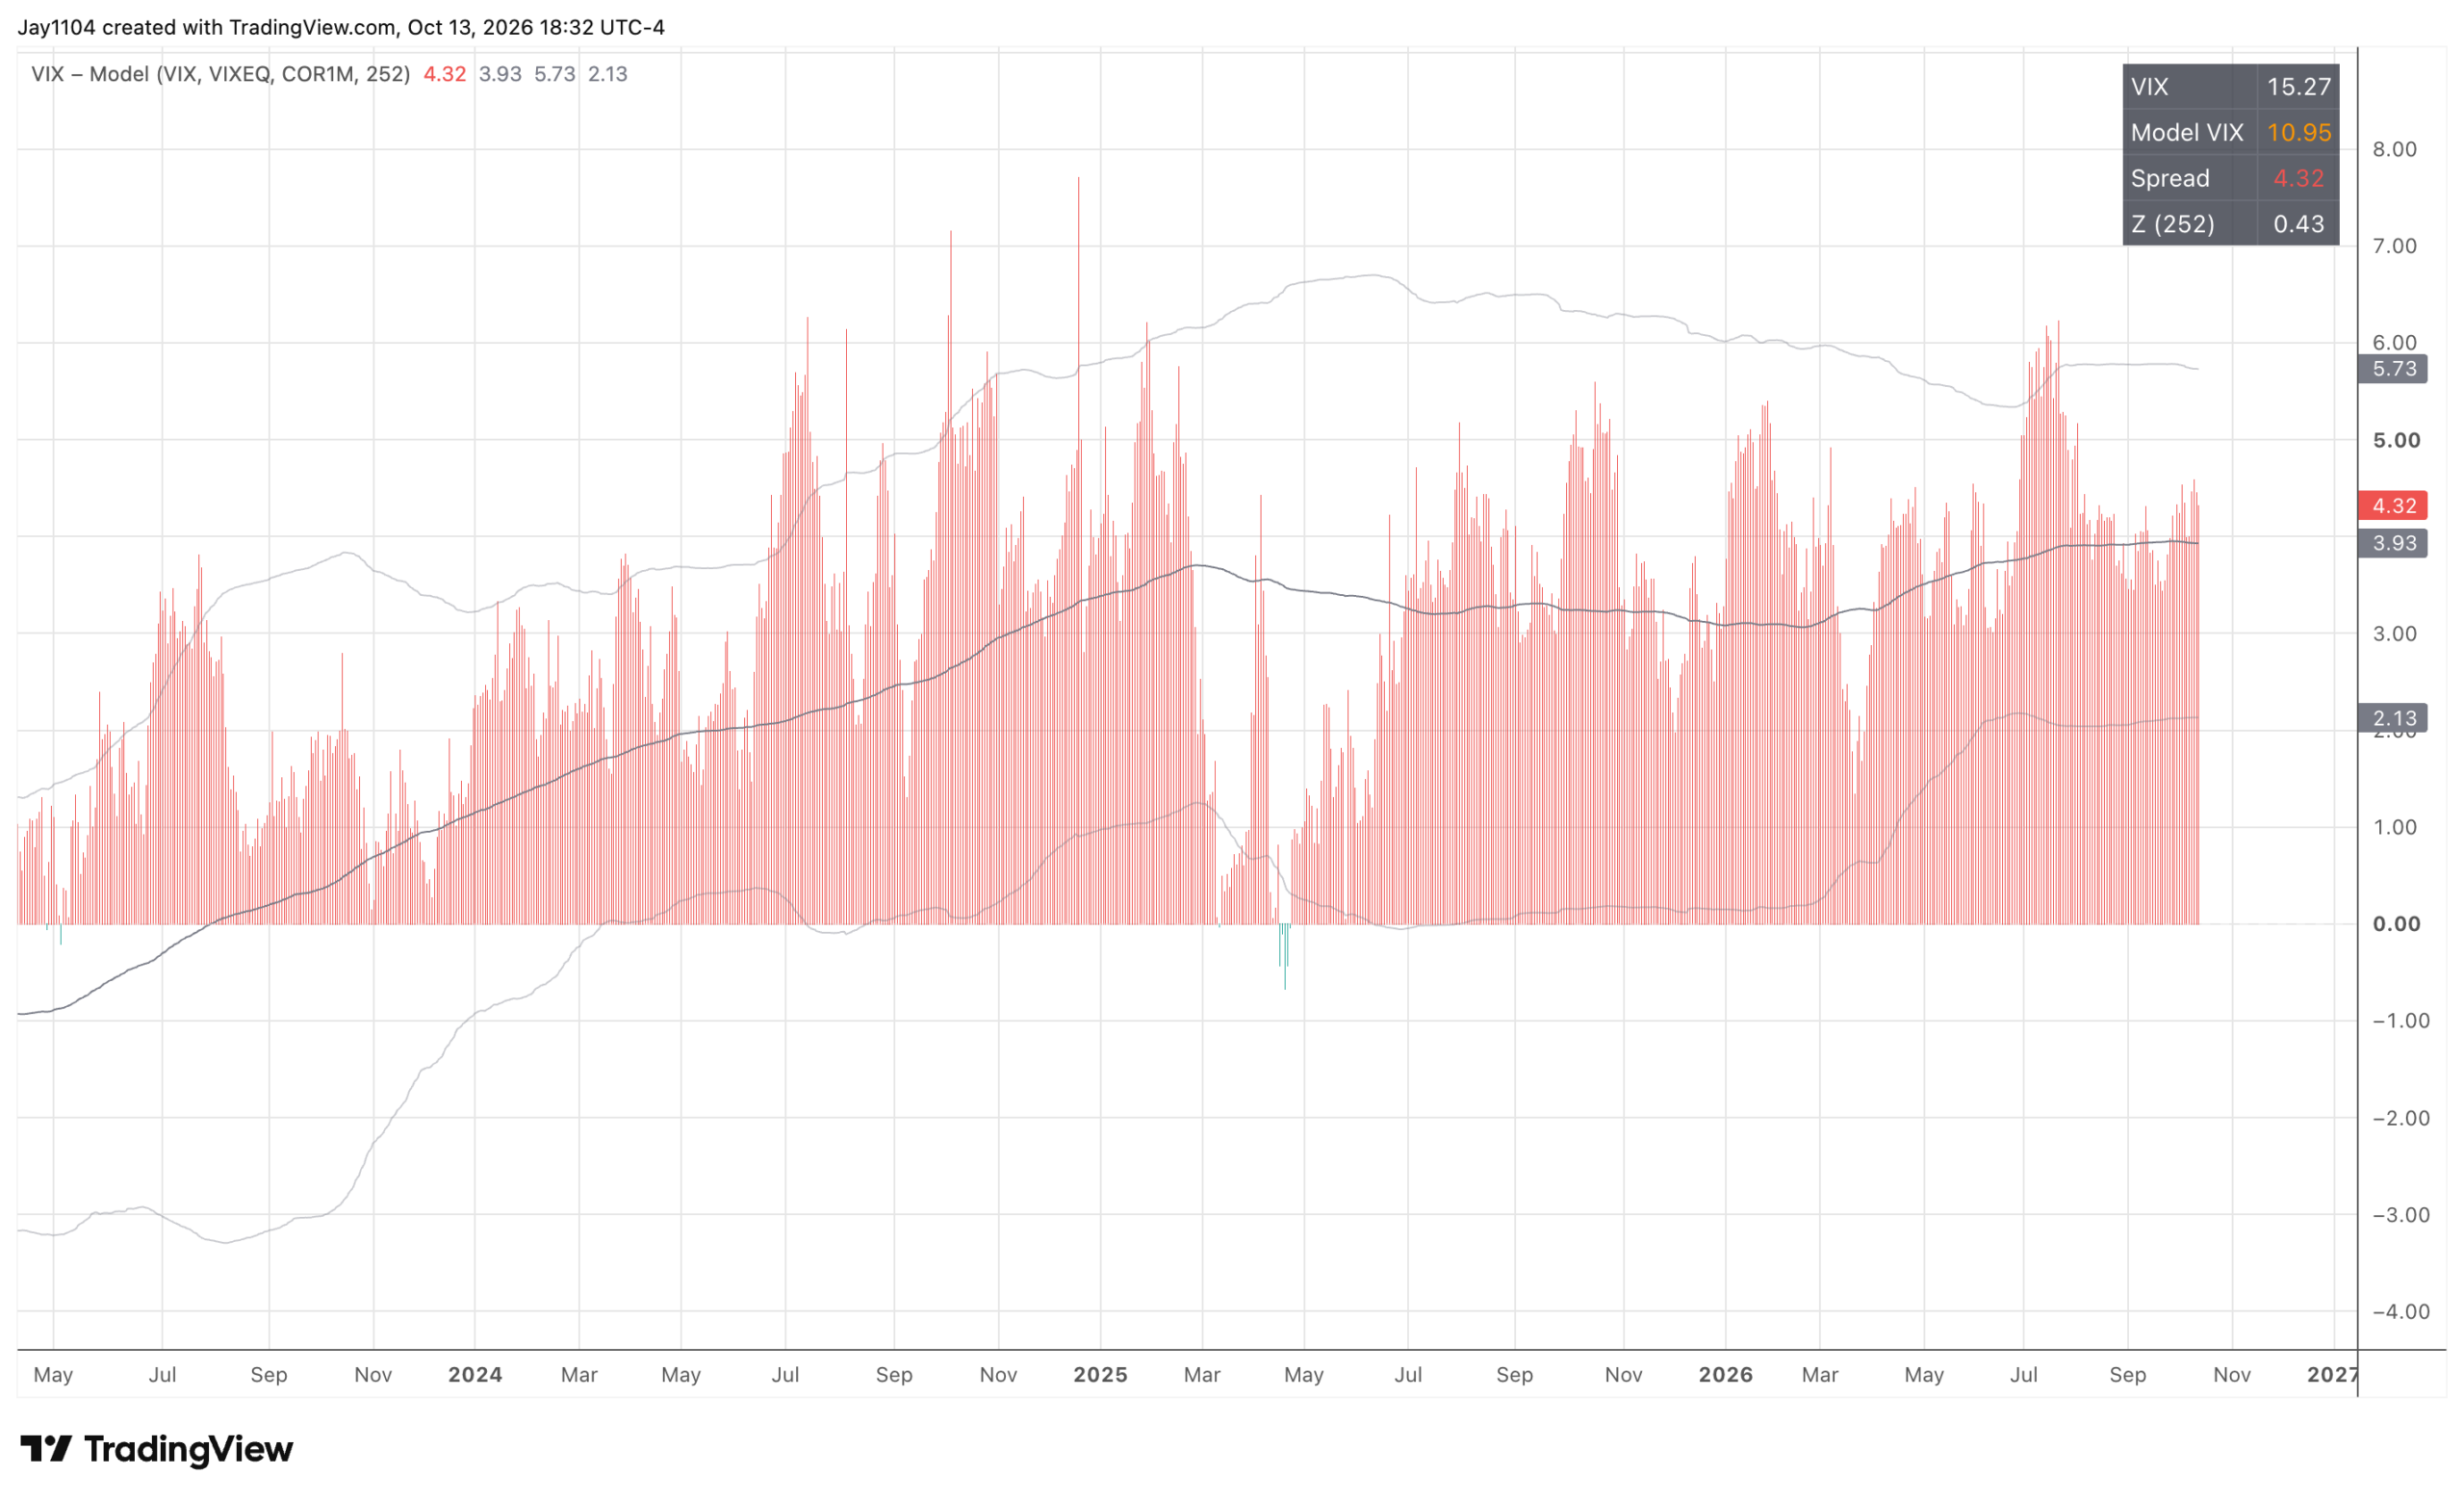
The VIX 1-Day has reached 10.7, a notably low level ahead of a Consumer Price Index (CPI) report. While this is an improvement from single digits, the figure could fluctuate to either 7 or 15 following the upcoming data release.
Read More
Concurrently, the 9-day realized volatility has dipped below 7, currently sitting at 6.93%. This low level indicates that any movement in the S&P 500 exceeding approximately 40 basis points could push realized volatility higher. It’s possible that realized volatility may continue to decrease; however, that would imply limited movement in the index.
Not long ago, 9-day realized volatility was in the 4s, indicating that volatility measures are nearing their lower limits. Understanding the interplay between implied correlations and single-stock volatility is critical here. Despite the decline in realized volatility, the VIX has remained relatively stable within the 14 to 16 range, as indicated by our model. Low implied correlations are inhibiting a significant drop in the VIX. Even if the 1-month implied correlation index elevates to 4, and VIXEQ reaches 50, the model suggests a VIX around 10, with a typical spread maintaining between 3 to 4 points, projecting a VIX of 13 or 14. While a narrower spread to 2 points is plausible, the focus remains on minor declines in the VIX versus the potential for significant increases.
Additionally, the SPY-to-RSP ratio is showing signs of an inflection point and appears to be forming a triple top. This indicates a likely increase in correlation between the RSP and SPY in the near future. Potential outcomes could include a quicker drop in the S&P 500 relative to the RSP, a faster rise of the RSP compared to the SPY, or a situation where the SPY declines while the RSP appreciates. This trend could signify an important regime shift in the market.
Historically, past occurrences of such an inflection point have led to notable increases in implied correlation. As a result, heightened volatility seems likely moving forward.